OK, this isn't about how to get a pet bioinformatician but a response to many of my students on the questions to ask regarding choosing a PhD position. Bioinformatics skills are in demand and labs typically have an abundance of data. It can be the case that a PhD student is seen as the best way to get skills in house to process that data - in the words of Francis Crick 'solving other peoples crossword puzzles'. Without the right environment you will not thrive and grow, and thus your opportunities to move on become limited. You become trapped as a pet bioinformatician.
The task when finding a good PhD position is one where you can grow in skills, grow in your scientific knowledge and build a reputation through asking and answering new questions in a good way. To do that you need infrastructure and mentors, both official and unofficial, who can help and inspire.
I would also encourage you to read the post by Professor Geoff Barton which explains a bit more about the UK academic system.
Question 0 - Why do you want to do a PhD?
Yes I number things from 0, but this isn't a question to ask of your prospective supervisor but of yourself. Why do you want to spend the next 4 years doing further study? In the UK this is typically a three year research project under a single supervisor, often after a period of training and rotation projects. Doing a bioinformatics PhD can be a great thing to do even without a view to a career in academia. There are very few supported roles where you get the opportunity to learn and develop at such a rate. But you need motivation and self-discipline to get the best out of it. So having decided that you want to go for it, and don't want to become a pet, here are questions to ask of potential positions.
Question 1 - What is the environment like?
Look at the institute. How many other bioinformaticians are there in the institute? How many of them are in leadership (PI, management) roles? Without an environment that has experts in your field it is difficult to get suitable recognition. Are there bioinformatics seminars? Is there a bioinformatics support group (mailing list/coffee morning/slack channel) to allow you to interact with other bioinformaticians outside your group? What is the lab culture like? Have they heard of Athena SWAN and how do they approach that? A culture of overwork does nobody any good.
Question 2 - What about the lab?
A key bioinformatics skill, indeed it is an ILO for several of my courses, is the ability to look new things up and apply them. However it is very difficult as a baby bioinformatician to know whether these are the best way to do things. Who in the lab, who you will have contact with on a day to day basis, is competent at training you in the things in which you will need to be trained?
Question 3 - What about the training?
What are the opportunities for training? Are there formal courses run in the institute? Do you have training events like Software Carpentry? Has your potential supervisor even heard of Software Carpentry? If there are external courses/workshops available, will you be able to go to them?
Question 4 - Is the supervisor competent to supervise a bioinformatics project?
Serious, but challenging question for a prospective student to ask. How do you assess whether you supervisor can actually supervise? Look at their publications. Ask them who did the bioinformatics on them. Does the supervisor have any bioinformatics skills beyond the web interface of their favourite database? Would they recognise a command line, or be able to give you guidance in how to structure an R or Python module tailored to your work? They don't necessarily need specific skills if there are others in the lab who can, but should be able to appreciate the technical details of what you are doing. And if the PI is reliant on others, how stable is their position?
Question 5 - Whose question is it anyway?
A key trap for bioinformatics students is to get carried away with the joy of developing your technical skills and forget to apply them to the biology. Building new tools and learning new skills is part of the trade, but it isn't all of it. Good tools are hard to do well, and there is a tool graveyard full of PhD projects. Ultimately the purpose is to ask and answer questions about biology and further your understanding. Will you have the freedom to develop your own lines of enquiry or will you be stuck developing new ways to answer other peoples questions?
Question 6 - Can you do it your way?
The most important thing in science is the question, not the means to the answer. A supervisor who insists you only use a specific tool (typically because that is the only one they know), should be a red flag. There are many good reasons for a lab to settle and require (in the absence of a good case to the contrary) that you use certain tools so that the knowledge gained is shareable - e.g. Python/git and certain testing frameworks. But that is not what is essential here. Can you suggest alternative ways to the answer or does the lab head insist it is only done with a certain package?
A related question is time to read more broadly - will that be encouraged? It is hard to think outside the box of your mind is always focussed within it.
Question 7 - Does it add up?
Will you have suitable statistics and analytical support? By this I mean those who can advise rather than do it for you. Is the supervisor statistically savvy - do they know what they are doing or are statistics an afterthought. If all their stats are done in Excel, that could be a bad sign. Do they encourage you to enhance your analysis toolkit or is stats a pernicious evil between them and publication?
Question 8 - Leading lady or supporting cast?
Which bioinformatics heavy papers have been published from the lab and where was the bioinformatician in the author list? If the intellectual direction of the paper is set through the analysis then it should be a bioinformatician as the lead author. How many non-tool description papers has the lab published where PhD students, and particularly bioinformatics PhD students are first author? What does the supervisor envisage from your project if you need data to be produced by others in the lab? Will you even be allowed to ask that question? Is your project to develop new insights in existing data with a specific question or questions, or is it to develop new methods and ways of thinking about more general questions? These require different approaches.
Question 9 - Can you meet the lab?
If you can't meet the lab then this is a big red flag. Find out from them what the PI is like to work for, where the lab members see themselves going and why. How many conferences do they get to attend? How much collaborative work with other labs? You must be able to meet them without the supervisor present - a supervisor who is paranoid about what their lab says about them is unlikely to foster a good working relationship.
Question 10 - What resources will you have access to?
Is there a supported research computing environment or will you be maintaining your own machine (and having to learn sysadmin skills as well)? Are there supported databases, file storage etc that are sufficient for your needs? Does the lab have it's own group repository? Can you get access to the compute you need, when you need it?
Monday, 17 December 2018
Thursday, 8 November 2018
Kick the fires and light the tyres
As part of my introductory module on python programming for biologists I have a capstone project on world domination. OK, that may be a little extreme, but the gift that programming brings is the empowerment of the individual to take control, to divest oneself of tedium and to do things one couldn't do before.
The project is in essence quite simple. As Life Sciences students, they have become intimately familiar with the UV-visible light spectrometer. They have performed assays, scans, collected time data. All manually. All recorded by hand. The spectrometers we use are quite basic, a Jencons 6305 which is quite dated by modern standards. However, it does have a serial interface (RS232) and the manual lists the communication protocol so there is every scope for getting it connected to a microcomputer. So this is what we do - connect the Pi to the spec and the students are then given free creative reign to design and develop their own application.
There are a few technical hurdles to overcome. We have used Pi Zero, a sub £10 computer. However, by the time you have added an HDMI converter (£6) and a USB extension (£10) it is not very different in cost to a full Pi 3 which has much more processing power. The jury is out on whether we should change as we upgrade.
For the serial interface we have used the RS232 interface from ABelectronics (all links at the end of the post). This is a board with the header pins that has a voltage shifter (important to avoid blowing up the Pi) and an RS232 9 pin D sub connector. Just what we need to connect to the spec using the 9/25 way serial lead that is supplied with it (and is probably in a box at the back of the technicians cupboard). There are a few gotchas. Those used to using computer to computer serial connections are probably unused to hardware flow control. This is NOT implemented on the serial board so it requires additional jumpers to ensure that the computer and spec can communicate. In essence, with hardware that can take time to respond or process information, there are parallel channels (4 of the other leads) that communicate whether the sender and recipient are ready to send/receive.

Having connected the correct pins together and to a logical high, communication is enabled. The way I have done this is a bodge - the signal is always at ready so any delays that are necessary are implemented in software. The Pi does need to be enabled for serial communication (ON) with the serial terminal OFF. This can be done in raspi-config very easily in the Interfaces section.
For a novice programming class, dealing with the intricacies of serial communication is a bit more advanced than they need so I provide a python module that does the heavy lifting. The students access this by cloning from Github (link below) and can then enable a spectrometer very simply.
So what can we do with a computer controlled spec that we cannot do otherwise? This is given over entirely to the students. We develop in a dry lab so have no ability to use reagents in the specs. I do however have samples of transparent coloured perspex generously donated by Kitronik, and theatre lighting gels from Rosco which provide a rich selection of options to work with.
Some students choose to implement a kinetics project, others projects to determine the difference between two samples in full wavelength scans. In a previous year, one group enabled the spec to translate the colour of a pH indicator solution to the pH of the sample. In all cases, the code they develop should provide full instructions to the user, and be well documented and under version control. We use Bitbucket, the students hold and manage their own repositories there.
This week was week 1 of three. The students get 3 4 hour lab sessions over the three weeks, with time in between to work together on formulating ideas and writing code that can then be tested in the lab.
So apart from saving time and frustration, and performing the analysis afterwards, what else can we do? One of my colleagues runs a cell culture module and they use Luciferase, or they would if we had enough luminometers to make it viable for a class of 40. Having read the spec manual I knew there were commands for turning off the lamp (closing the shutter) and also for reading the raw voltage from the sensor. Could this be used to repurpose the spec as a luminometer? It is not possible to do this from the front panel.
I needed a light source that was dry and could fit in a cuvette. The answer came with a pack of fishing glow sticks I had bought during one of the local supermarket 'specials' a few years back with the idea of using them for a project that never materialised. I cracked one open and left it overnight. Into the lab, and I could run the code to control the spec. Turn off the lamp, check the voltage. Place the glow stick in and check the voltage. Take a new glowstick and crack it open, check the voltage.
Bingo! We can measure a clear change that should give a sufficient resolution.


My colleagues are happy, and the next step is to try a proper luciferase assay, then to add an LCD screen and to build a box to turn this into a lab-safe add on for the spec.
Links:
Jenway 6305 Spectrometer
AB Electronics serial interface for Raspberry Pi
www.Kitronik.co.uk - supplier of materials
www.thepihut.co.uk - Supplier of Raspberry Pi related goods
www.pimoroni.com - Supplier of Raspberry Pi related goods.
github repository for UvSpec code
Rosco Laboratories - Theatre gels and other great lighting products
The project is in essence quite simple. As Life Sciences students, they have become intimately familiar with the UV-visible light spectrometer. They have performed assays, scans, collected time data. All manually. All recorded by hand. The spectrometers we use are quite basic, a Jencons 6305 which is quite dated by modern standards. However, it does have a serial interface (RS232) and the manual lists the communication protocol so there is every scope for getting it connected to a microcomputer. So this is what we do - connect the Pi to the spec and the students are then given free creative reign to design and develop their own application.
There are a few technical hurdles to overcome. We have used Pi Zero, a sub £10 computer. However, by the time you have added an HDMI converter (£6) and a USB extension (£10) it is not very different in cost to a full Pi 3 which has much more processing power. The jury is out on whether we should change as we upgrade.
For the serial interface we have used the RS232 interface from ABelectronics (all links at the end of the post). This is a board with the header pins that has a voltage shifter (important to avoid blowing up the Pi) and an RS232 9 pin D sub connector. Just what we need to connect to the spec using the 9/25 way serial lead that is supplied with it (and is probably in a box at the back of the technicians cupboard). There are a few gotchas. Those used to using computer to computer serial connections are probably unused to hardware flow control. This is NOT implemented on the serial board so it requires additional jumpers to ensure that the computer and spec can communicate. In essence, with hardware that can take time to respond or process information, there are parallel channels (4 of the other leads) that communicate whether the sender and recipient are ready to send/receive.

Having connected the correct pins together and to a logical high, communication is enabled. The way I have done this is a bodge - the signal is always at ready so any delays that are necessary are implemented in software. The Pi does need to be enabled for serial communication (ON) with the serial terminal OFF. This can be done in raspi-config very easily in the Interfaces section.
For a novice programming class, dealing with the intricacies of serial communication is a bit more advanced than they need so I provide a python module that does the heavy lifting. The students access this by cloning from Github (link below) and can then enable a spectrometer very simply.
from J6305 import SpectrometerThat is the essence. There are methods for controlling all the options the spec gives, and some utility methods such as spec.scan(start, stop, interval) which performs a scan across wavelengths from low to high. The module is documented so students can identify useful methods with help(spec) and by reading the source.
spec = Spectrometer()
spec.set_wavelength(420)
(absorbance, wavelength) = spec.absorbance()
So what can we do with a computer controlled spec that we cannot do otherwise? This is given over entirely to the students. We develop in a dry lab so have no ability to use reagents in the specs. I do however have samples of transparent coloured perspex generously donated by Kitronik, and theatre lighting gels from Rosco which provide a rich selection of options to work with.

Some students choose to implement a kinetics project, others projects to determine the difference between two samples in full wavelength scans. In a previous year, one group enabled the spec to translate the colour of a pH indicator solution to the pH of the sample. In all cases, the code they develop should provide full instructions to the user, and be well documented and under version control. We use Bitbucket, the students hold and manage their own repositories there.
This week was week 1 of three. The students get 3 4 hour lab sessions over the three weeks, with time in between to work together on formulating ideas and writing code that can then be tested in the lab.
So apart from saving time and frustration, and performing the analysis afterwards, what else can we do? One of my colleagues runs a cell culture module and they use Luciferase, or they would if we had enough luminometers to make it viable for a class of 40. Having read the spec manual I knew there were commands for turning off the lamp (closing the shutter) and also for reading the raw voltage from the sensor. Could this be used to repurpose the spec as a luminometer? It is not possible to do this from the front panel.
I needed a light source that was dry and could fit in a cuvette. The answer came with a pack of fishing glow sticks I had bought during one of the local supermarket 'specials' a few years back with the idea of using them for a project that never materialised. I cracked one open and left it overnight. Into the lab, and I could run the code to control the spec. Turn off the lamp, check the voltage. Place the glow stick in and check the voltage. Take a new glowstick and crack it open, check the voltage.
Bingo! We can measure a clear change that should give a sufficient resolution.

My colleagues are happy, and the next step is to try a proper luciferase assay, then to add an LCD screen and to build a box to turn this into a lab-safe add on for the spec.
Links:
Jenway 6305 Spectrometer
AB Electronics serial interface for Raspberry Pi
www.Kitronik.co.uk - supplier of materials
www.thepihut.co.uk - Supplier of Raspberry Pi related goods
www.pimoroni.com - Supplier of Raspberry Pi related goods.
github repository for UvSpec code
Rosco Laboratories - Theatre gels and other great lighting products
Wednesday, 3 October 2018
Almost, but not entirely, unlike chemistry
It is the start of the academic year (OK a few weeks in) and we are working through basic chemistry with our new intake. The task today is pH and buffers. A simple manipulation of numbers with logarithms and some rearrangement of equations.
We are, of course, using ducks to provide assistance to the students. What had constantly puzzled me is the lack of competence of many of the students who have obtained a top grade in chemistry to work with basic mathematics in a chemistry context. It was whilst pondering this as I explained logarithms for the nth time that I saw on the desk a document which will be familiar to teachers and students alike.
These equations form then backbone of much numerical analysis and bench calculations in the science that we do. What struck me was not what was there, but what was not there. Look again closely. What is missing?
If you are trying to find an equation that is missing then you are on the wrong track. It is the way the information is presented, and having talked to many students and teachers in post-16 pre-HE education this is symptomatic of science across the board.
THERE ARE NO UNITS!
No, not one. Every equation is given as a series of labels to be learned. A series of facts to be put in the correct place. Without units there is no possibility of understanding the relationship between for example molarity, mass and volume. Or when a number is a ratio and can therefore be scaled, an absolute quantity and can be added, and so on.
With units underpinning the equations then they pretty much explain themselves. Instead of learning different rearranged equations, learn the units and then you can construct whichever equations you want.
So if you are a post-16 secondary science teacher, wondering about how best to prepare your students for university, please include the units. Teach them to use the units - an approach called dimensional analysis. Units balance and give understanding to the labels. So often we come across students who switch off because they recognise the labels and think they know the topic, but they have no understanding of the meaning behind those labels and then fail dismally when asked to explain, rather than recite.
Is this endemic across secondary science? I do hope not but I fear it might be. I suggest that the problem arises from a curriculum that is so packed the students have no time to think and play with the data, just scarcely enough time to hear, memorise and recite. It is frustrating for the teacher and the university, and does not serve the student well. In the words of one of my colleagues,we need to 'cover less, uncover more'. Give the students time and space to think.
The driver for this has to be the SQA and its English counterparts. Individual teachers do the best they can but have no time or space to deviate from the curriculum dictated gavage of factoids and labels. Change the curriculum, look at the transferable skills students should be getting from post 16 study and teach to deliver those, not some idealistic and unachievable tick box of topics.
The lack of units is not the cause here - it is a symptom. And a very worrying one at that.
Are you a secondary science teacher? Does this resonate with you or have I completely misread this? Let me know in the comments below.
Update:
It isn't that bad, it's worse. I met today with a young former teacher who left the profession at the end of the last academic year. She taught upper level chemistry and was criticised for including units in her teaching. She had been doing exactly what I wish schools would do, teaching the relationships between quantities by using units to derive equations that had not been adequately memorised. The rationale given was that if you give a correct answer with the correct units you get a mark. If the answer is correct but includes no units then you get the same mark, but if the number is correct but the units are wrong you get no mark. So it is safer to teach the students to not use units or they may be penalised. What a mad world we live in. It is increasingly clear that it is the short sightedness of a tick box exam mentality that is doing us and our students a disservice, and requiring that we retrain students in practices they should be using from day 1.
We are, of course, using ducks to provide assistance to the students. What had constantly puzzled me is the lack of competence of many of the students who have obtained a top grade in chemistry to work with basic mathematics in a chemistry context. It was whilst pondering this as I explained logarithms for the nth time that I saw on the desk a document which will be familiar to teachers and students alike.
 |
| Part of the SQA formula book |
If you are trying to find an equation that is missing then you are on the wrong track. It is the way the information is presented, and having talked to many students and teachers in post-16 pre-HE education this is symptomatic of science across the board.
THERE ARE NO UNITS!
No, not one. Every equation is given as a series of labels to be learned. A series of facts to be put in the correct place. Without units there is no possibility of understanding the relationship between for example molarity, mass and volume. Or when a number is a ratio and can therefore be scaled, an absolute quantity and can be added, and so on.
With units underpinning the equations then they pretty much explain themselves. Instead of learning different rearranged equations, learn the units and then you can construct whichever equations you want.
So if you are a post-16 secondary science teacher, wondering about how best to prepare your students for university, please include the units. Teach them to use the units - an approach called dimensional analysis. Units balance and give understanding to the labels. So often we come across students who switch off because they recognise the labels and think they know the topic, but they have no understanding of the meaning behind those labels and then fail dismally when asked to explain, rather than recite.
Is this endemic across secondary science? I do hope not but I fear it might be. I suggest that the problem arises from a curriculum that is so packed the students have no time to think and play with the data, just scarcely enough time to hear, memorise and recite. It is frustrating for the teacher and the university, and does not serve the student well. In the words of one of my colleagues,we need to 'cover less, uncover more'. Give the students time and space to think.
The driver for this has to be the SQA and its English counterparts. Individual teachers do the best they can but have no time or space to deviate from the curriculum dictated gavage of factoids and labels. Change the curriculum, look at the transferable skills students should be getting from post 16 study and teach to deliver those, not some idealistic and unachievable tick box of topics.
The lack of units is not the cause here - it is a symptom. And a very worrying one at that.
Are you a secondary science teacher? Does this resonate with you or have I completely misread this? Let me know in the comments below.
Update:
It isn't that bad, it's worse. I met today with a young former teacher who left the profession at the end of the last academic year. She taught upper level chemistry and was criticised for including units in her teaching. She had been doing exactly what I wish schools would do, teaching the relationships between quantities by using units to derive equations that had not been adequately memorised. The rationale given was that if you give a correct answer with the correct units you get a mark. If the answer is correct but includes no units then you get the same mark, but if the number is correct but the units are wrong you get no mark. So it is safer to teach the students to not use units or they may be penalised. What a mad world we live in. It is increasingly clear that it is the short sightedness of a tick box exam mentality that is doing us and our students a disservice, and requiring that we retrain students in practices they should be using from day 1.
Thursday, 13 September 2018
It's really not about the ducks
I received some very strange looks from my colleagues when I stated that I was no longer going to allow students to put their hands up in my IT workshops to ask for help. Nope, not even once.
What is this nonsense you might ask, or in terms of the name given to the initiative, What the Duck?
Let's make one thing very clear at the outset, students can ask for help during my classes, but they have to do it in a specific way. I will elaborate but first some background.
There is a very successful initiative for improving the programming and data management of primarily postgraduate and postdoctoral scientists who are not computing specialists. This initiative, Software Carpentry (and it's allied friends) takes a strongly evidence based pedagogy and uses some smart methods in the classroom. One of those is the application of red and green post-it notes. When a student requires help they put the red sticky up on their monitor. When they have completed the task at hand the green sticky is used to indicate visually to the instructor that they are ready to move on. This is an effective method for those classes which are high intensity with highly motivated and high calibre participants.
I have translated this to my classes. I don't use stickies (though they are usable in this context) but instead simplify the approach to this:
Whilst the duck is there, explain the problem, talk it through. Often the student solves the problem and takes down the duck before the instructor can reach them. But while the duck is doing the attracting, the student can concentrate on the task, eyes are on the screen, hands are on the keyboard.
How well does it work? It is only the start of semester and only one class in but the students got the idea very quickly and really liked the ducks/sheep/penguins/swans/hedgehogs etc. I distributed. This is a small class in an elective module - the large classes will have to earn their ducks through interaction in lectures/workshops. The response was great - I could see that ducks that had been up were taken down before I could attend to that student. And while students had ducks up on their monitors they were actively engaged in attempting to solve the problems rather than being engaged in attracting the instructor's attention.
So a positive response so far from the students and the desired behaviour in the classroom. We'll see how it plays out through the rest of semester and larger classes.
Edit: We are now three weeks in and the ducks are extremely popular. The class is less stressed and students are keen to bring in their own personal ducks (or win some for answering questions in class). It is surprising how easy it is to see almost anything on top of a monitor screen, even in a room of 150 (our largest IT lab).
Has this inspired you to try ducks in your classroom? If so, please let me know how you get on via a comment or email.
What is this nonsense you might ask, or in terms of the name given to the initiative, What the Duck?
Let's make one thing very clear at the outset, students can ask for help during my classes, but they have to do it in a specific way. I will elaborate but first some background.
There is a very successful initiative for improving the programming and data management of primarily postgraduate and postdoctoral scientists who are not computing specialists. This initiative, Software Carpentry (and it's allied friends) takes a strongly evidence based pedagogy and uses some smart methods in the classroom. One of those is the application of red and green post-it notes. When a student requires help they put the red sticky up on their monitor. When they have completed the task at hand the green sticky is used to indicate visually to the instructor that they are ready to move on. This is an effective method for those classes which are high intensity with highly motivated and high calibre participants.
I have translated this to my classes. I don't use stickies (though they are usable in this context) but instead simplify the approach to this:
If you want help, talk to the duck!The duck is anything that you can stick on the top of your monitor. It is surprisingly easy to detect any perturbation in the smooth flat line of a monitor from across the classroom.
Whilst the duck is there, explain the problem, talk it through. Often the student solves the problem and takes down the duck before the instructor can reach them. But while the duck is doing the attracting, the student can concentrate on the task, eyes are on the screen, hands are on the keyboard.
How well does it work? It is only the start of semester and only one class in but the students got the idea very quickly and really liked the ducks/sheep/penguins/swans/hedgehogs etc. I distributed. This is a small class in an elective module - the large classes will have to earn their ducks through interaction in lectures/workshops. The response was great - I could see that ducks that had been up were taken down before I could attend to that student. And while students had ducks up on their monitors they were actively engaged in attempting to solve the problems rather than being engaged in attracting the instructor's attention.
So a positive response so far from the students and the desired behaviour in the classroom. We'll see how it plays out through the rest of semester and larger classes.
 |
| Yes, all of these are ducks, in the right context. |
Has this inspired you to try ducks in your classroom? If so, please let me know how you get on via a comment or email.
How hard can it be? Part one of a saga.
It started, as do many things, with an idle conversation in front of a white board. (I'm starting to realise that white boards are dangerous places). One of my colleagues, a talented immunologist who spearheads our undergraduate cell culture modules, had seen the laser pen microscope and commented 'It would be great to adapt this to use as a cell counter'. She has been trying to get one into the lab but it isn't economically viable at the moment. How hard can it be to build a fluorescent cell counter/analyser on a minimalist budget (ie a few £10s )?
Lasers
We have lasers. For a few pounds you can buy a laser pen that gives a reasonably coherent light. I bought several for a fiver from eBay and now have wavelengths of 405nm, 535nm and 620nm (blue, green and red respectively). So we have a source of light.
Filters
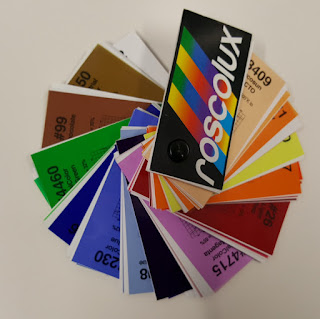
Filters for a commercial system are typically precision optical glass, carefully manufactured and a premium price. Way more than we could afford on the shoestring budget allocated (I rummaged down the back of the sofa and found a few bits of spare change, a button and some random electronic components). However, there is a very cheap source of filters. The theater industry use many colours on lightweight plastic filters. Rosco provide spectrograms for all their filters so we can spend many hours scanning their web site to identify filters that will act as high-pass (to capture the excitation wavelength but exclude the incident) and a low-pass to capture the incident light without any contribution from the emitted light.
This gets us two components - the challenge now is leveraging these in a way where we can work with it. One of those aspects is detecting and measuring the light, the other is scaling this to a level where we are working on just a single cell. The former of these will be dealt with later.
Optics
To focus a laser beam requires a lens. Identifying suitable lenses (ie very cheap) is challenging so it is time to think creatively. An acrylic rod that is optically clear will focus the light to a line from the round dot of the laser pen. A quick google identifies a suitable equation for calculating the focal length of a cylinder of known refractive index and diameter. In short, this tells us that a laser beam will be focused to a point 7.6 mm from the centre of a 10mm acrylic rod.
Having now obtained a suitable rod, a quick play around indicates that this will be about right. So this problem is solved. We can put a disc from the rod before, to focus the light, after to gather the transmitted light, and at right angles to catch the emitted fluorescent light. In principle we could use two different discs, one on each side to capture two different incident lights but that proves difficult to easily design. So we will stick with one fluorescent label.
Electronics
This is not too difficult (I always seem to say that at the start of a project). Phototransistors are cheap and have a broad sensitivity. Light causes the resistance they exhibit to drop. We can wire this in to a voltage divider and turn the change in resistance to a change in voltage. In order to boost detection we can feed this voltage into an op-amp in differential mode, the other input being a voltage that can be adjusted to set a zero. We are then measuring the change in voltage rather than absolute voltage (signals can go up and down. You may not get back the electrons you invest).
This signal can then be fed into a second op-amp that is used as an amplifier, so a second variable resistor can be used to adjust the gain. The output from this is then read through an Analogue to Digital Converter and read by a Raspberry Pi. That at least seems a sensible plan to start with.
And now the big challenge.
The Flow Cell
How big are the cells we want to look at? Different cells give different sizes. Ultimately our flow cell size will be determined by what it is feasible to manufacture. The narrowest hole I think I can drill is 0.3 mm so the plan is to take a 4mm square perspex bar and drill a 0.3 mm diameter hole down the absolute centre, then to glue some larger tube to each end of the cell. I can find 5mm OD, 3mm ID clear perspex tube that should do the trick. I had considered using a laser to make the channel in a triangular piece and then construct the flow cell from two pieces, but the width of the laser cut is probably in the order of 0.5-0.6mm and any interface will have optical challenges, so careful use of a drill press it will be. There is a plan B if this doesn't work which gives us the potential to do even smaller holes but more on that later if it is needed.
This should give us a cell of 0.3 mm diameter. To limit the effective flow cell size, the laser can be pointed through a narrow (0.1-0.2) slit across the flow cell so we have a maximum size of about 0.2 * 0.3mm. If a cell is 25 micron diameter then we are looking for a maximum pertubation of the signal of about 1% for a single cell. That should be detectable if we use differential signal analysis with a suitable gain.
Other considerations
Holding a 4 mm rod in a vice under a drill press will be challenging. Instead of holding it directly I will make a jig with a 3D print that has a 4mm receptacle in the centre. The jig can be tightly clamped in the right position and then multiple flow cells drilled without having to constantly reset alignment. Likewise, gluing 5mm and 4mm pieces together end on will be challenging. A jig will be 3D printed to allow pieces to be held in place without risk of gluing them to the substrate.
Enabling flow in the optical cell is the final challenge. We have thought to use a peristalsic pump, or just a hand held syringe but one of my colleagues has instead suggested a venturi pump on the outflow (a water pump to those used to school chemistry lessons). This will keep a constant pressure differential without overstressing the components.
Design in CAD
I've used TinkerCad (from Autodesk) to design the pieces. It is freely available and cloud based.

The blue element is the main part. The laser pen comes in to the right hand side, firing through the first lens and the slit. The flow cell (clear) will be inserted in the slot and run front to back (or back to front, there is no real difference.)
The green element locks the lenses in place. There is a slight gap between the lenses and the flow cell of about 0.6mm which allows for the insertion of a sliver of filter gel.
The yellow element locks the flow cell in place.
The purple element is the jig for constructing the flow cell.
The red element is the jig to hold the central part of the flow cell for drilling.
Overall size is about 60x40x40mm.
These parts have now been 3D printed, perspex has arrived and needs cutting to size and drilling. Electronics components are ready and waiting.
Will this actually work as intended? I don't know but I'm going to have fun finding out. More posts will follow detailing construction, testing, coding and more.
Lasers
We have lasers. For a few pounds you can buy a laser pen that gives a reasonably coherent light. I bought several for a fiver from eBay and now have wavelengths of 405nm, 535nm and 620nm (blue, green and red respectively). So we have a source of light.
Filters
Filters for a commercial system are typically precision optical glass, carefully manufactured and a premium price. Way more than we could afford on the shoestring budget allocated (I rummaged down the back of the sofa and found a few bits of spare change, a button and some random electronic components). However, there is a very cheap source of filters. The theater industry use many colours on lightweight plastic filters. Rosco provide spectrograms for all their filters so we can spend many hours scanning their web site to identify filters that will act as high-pass (to capture the excitation wavelength but exclude the incident) and a low-pass to capture the incident light without any contribution from the emitted light.
This gets us two components - the challenge now is leveraging these in a way where we can work with it. One of those aspects is detecting and measuring the light, the other is scaling this to a level where we are working on just a single cell. The former of these will be dealt with later.
Optics
To focus a laser beam requires a lens. Identifying suitable lenses (ie very cheap) is challenging so it is time to think creatively. An acrylic rod that is optically clear will focus the light to a line from the round dot of the laser pen. A quick google identifies a suitable equation for calculating the focal length of a cylinder of known refractive index and diameter. In short, this tells us that a laser beam will be focused to a point 7.6 mm from the centre of a 10mm acrylic rod.
Having now obtained a suitable rod, a quick play around indicates that this will be about right. So this problem is solved. We can put a disc from the rod before, to focus the light, after to gather the transmitted light, and at right angles to catch the emitted fluorescent light. In principle we could use two different discs, one on each side to capture two different incident lights but that proves difficult to easily design. So we will stick with one fluorescent label.
Electronics
This is not too difficult (I always seem to say that at the start of a project). Phototransistors are cheap and have a broad sensitivity. Light causes the resistance they exhibit to drop. We can wire this in to a voltage divider and turn the change in resistance to a change in voltage. In order to boost detection we can feed this voltage into an op-amp in differential mode, the other input being a voltage that can be adjusted to set a zero. We are then measuring the change in voltage rather than absolute voltage (signals can go up and down. You may not get back the electrons you invest).
This signal can then be fed into a second op-amp that is used as an amplifier, so a second variable resistor can be used to adjust the gain. The output from this is then read through an Analogue to Digital Converter and read by a Raspberry Pi. That at least seems a sensible plan to start with.
And now the big challenge.
The Flow Cell
How big are the cells we want to look at? Different cells give different sizes. Ultimately our flow cell size will be determined by what it is feasible to manufacture. The narrowest hole I think I can drill is 0.3 mm so the plan is to take a 4mm square perspex bar and drill a 0.3 mm diameter hole down the absolute centre, then to glue some larger tube to each end of the cell. I can find 5mm OD, 3mm ID clear perspex tube that should do the trick. I had considered using a laser to make the channel in a triangular piece and then construct the flow cell from two pieces, but the width of the laser cut is probably in the order of 0.5-0.6mm and any interface will have optical challenges, so careful use of a drill press it will be. There is a plan B if this doesn't work which gives us the potential to do even smaller holes but more on that later if it is needed.
This should give us a cell of 0.3 mm diameter. To limit the effective flow cell size, the laser can be pointed through a narrow (0.1-0.2) slit across the flow cell so we have a maximum size of about 0.2 * 0.3mm. If a cell is 25 micron diameter then we are looking for a maximum pertubation of the signal of about 1% for a single cell. That should be detectable if we use differential signal analysis with a suitable gain.
Other considerations
Holding a 4 mm rod in a vice under a drill press will be challenging. Instead of holding it directly I will make a jig with a 3D print that has a 4mm receptacle in the centre. The jig can be tightly clamped in the right position and then multiple flow cells drilled without having to constantly reset alignment. Likewise, gluing 5mm and 4mm pieces together end on will be challenging. A jig will be 3D printed to allow pieces to be held in place without risk of gluing them to the substrate.
Enabling flow in the optical cell is the final challenge. We have thought to use a peristalsic pump, or just a hand held syringe but one of my colleagues has instead suggested a venturi pump on the outflow (a water pump to those used to school chemistry lessons). This will keep a constant pressure differential without overstressing the components.
Design in CAD
I've used TinkerCad (from Autodesk) to design the pieces. It is freely available and cloud based.

The blue element is the main part. The laser pen comes in to the right hand side, firing through the first lens and the slit. The flow cell (clear) will be inserted in the slot and run front to back (or back to front, there is no real difference.)
The green element locks the lenses in place. There is a slight gap between the lenses and the flow cell of about 0.6mm which allows for the insertion of a sliver of filter gel.
The yellow element locks the flow cell in place.
The purple element is the jig for constructing the flow cell.
The red element is the jig to hold the central part of the flow cell for drilling.
Overall size is about 60x40x40mm.
These parts have now been 3D printed, perspex has arrived and needs cutting to size and drilling. Electronics components are ready and waiting.
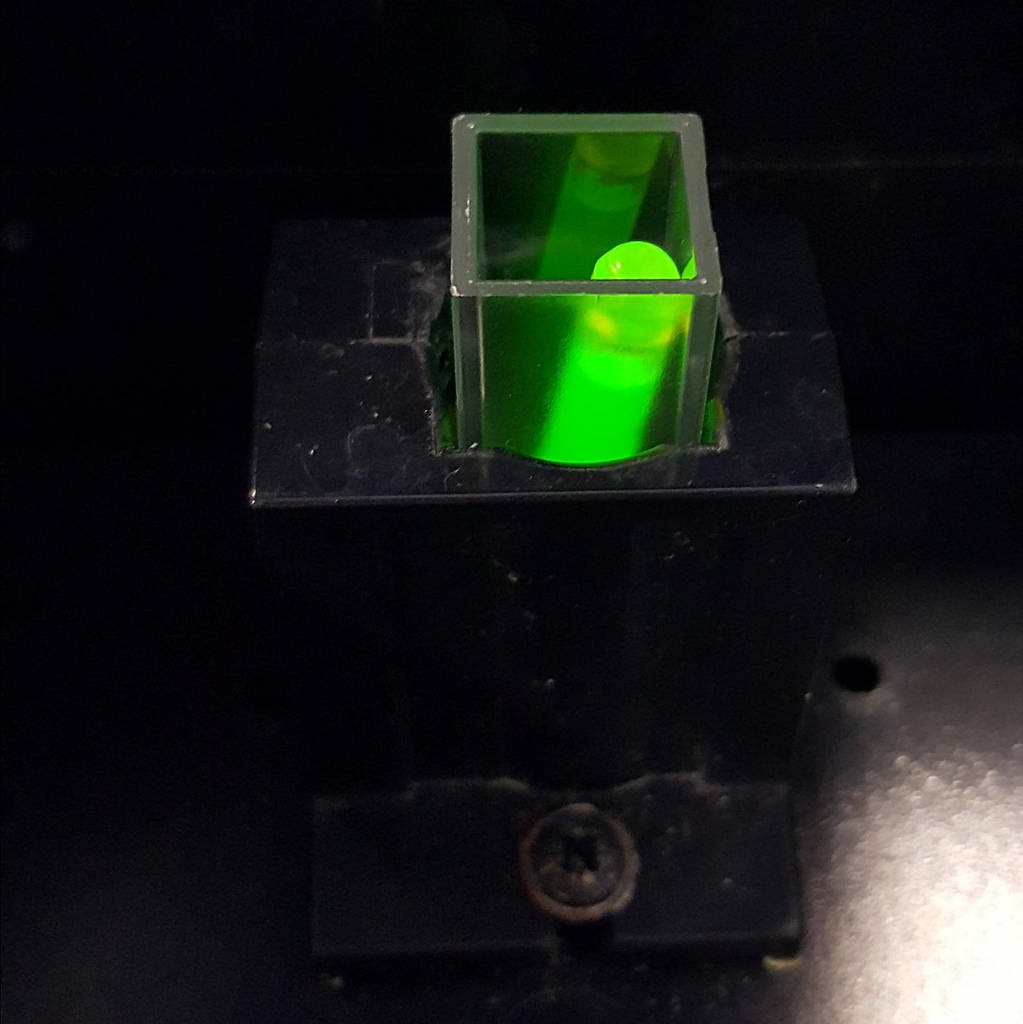
 |
| Testing - the laser pen fits. Other parts require a bit of finishing. |
 |
| The 3D print straight off the machine. The flow cell dummy is to the left. |
 |
| Parts ready to play. A phototransistor sits on the right hand foreground. |
 |
| Perspex (acrylic) bar and tube ready to turn into finished parts. |
Will this actually work as intended? I don't know but I'm going to have fun finding out. More posts will follow detailing construction, testing, coding and more.
Monday, 6 August 2018
Fold it, suck it, blast it, show it
Public engagement isn't to my mind so much about educating the public, though that is of course one of the aims, but of enthusing folk to educate themselves. One key way to do this is with hands-on discovery - when you find something with your own hands, or see it with your own eyes it has so much more of an impact.
I have been impressed with the work of Cristina Cipriano (@crizipri on Twitter) who is keen to bring low cost equipment to the general public. She has produced a 3D printed laser pen microscope which is pretty cool, but 3D printing isn't really my thing, and the pieces are very specific in size. A different brand of laser or syringe could lead to small alignment issues and not work as desired.
I put together a design to hold the laser pen and a syringe in a rigid folded cardboard that can be cut from a single A4 sheet. (plans here). The holes for the pen and syringe act as springs which hold them in place and can be tweaked to get perfect alignment.
How this works: The drop acts like a lens and will project whatever is inside as a image onto the surface behind the drop. I used a sample of dirty water from the bottom of the water butt in my garden.
I used single layer corrugated card. With careful attention to the laser cutter settings you can cut through just one wall at the folds making a very smart hinge.
And now for the health and safety. Lasers are dangerous. Laser pens can cause damage so treat them with respect. Look at what the laser is pointing at, not the laser itself.
Parts list:
1 A4 sheet of single wall corrugated card about 1.5mm thick
1 laser pen (about £1.50 on eBay)
1 10ml syringe with a luer tip (not luer lock or it won't fit down the hole.)
You will need a laser cutter or be very good at cutting out with a craft knife.


 Folding the cardboard is easy with the part through cuts along the fold lines.
 Before assembling the box, push the laser pen (abotu £1.50 on eBay) through the pen holder holes. The inner one has the cuts 'backward' so ensure you push it through in the right direction. Having a star cut allows for some 'wriggle' to get the laser nicely aligned.


Acknowledgements: All cutting was carried out at the Dundee Makerspace.
You will need a laser cutter or be very good at cutting out with a craft knife.

The first cut out. This used cardboard from an old shoe box.

Ready to go. The cut cardboard.


One side folded. The tabs slot through then bend to lock in place. It is quite robust. I've made some slight adjustments to the design shown here to make it easier to insert the tabs(rounded corners etc.)

A 10 ml syringe fits nicely. If you want to use a needle, this can just pierce the cardboard directly. The design includes a hole for the tapered tip.

In action. The peg is keeping the laser pen on and there is a scrap of cardboard rolled up to hold it in the right place (just off the bottom of the photo).

Please do not look in this end. This was viewed with the camera, not my eye. There are windows both sides for aligning the drop and the laser. I will repeat
DO NOT LOOK INTO THE LASER WITH YOUR REMAINING EYE.

And here is a picture - sludge from the bottom of the garden water butt. There is some diffraction, but movement of the particles can be clearly seen.
This will happily project onto a wall or large piece of card. Remember to not look into the laser.
Acknowledgements: All cutting was carried out at the Dundee Makerspace.
It's the little things that grind you down.
I am a big fan of rubrics. They help to structure the assessments and direct the activity towards the learning outcome to be assessed. We, as are many Higher Education Institutes, are big users of TurnItIn, the online assessment workbench. This has embedded rubrics and a suite of rubric management tools. We use rubrics to ensure clear marking and assessment guidelines, and consistency between different markers.
Unfortunately the rubric management tools are not the most user friendly, and many of my colleagues (and I) prefer to use a spreadsheet to edit and update out rubrics. Doing this online through the Rubric Manager is tedious and often frustrating when it times out and loses all your work.
TurnItIn has spreadsheet upload facilities but not download. The export from the rubric manager is in a JSON-like format and not particularly accessible for the lay person to amend.
I have a need to edit and share rubrics so I have put together a simple Python script that converts the .rbc file that you export from TurnItIn to a .csv that can be viewed/edited in Excel. Please note that this is not quite the format that is used for spreadsheet uploading, but amending the spreadsheet to the required format is quite straightforward.
The script is a Jupyter notebook (runnable on any of our uni computers through the Jupyter notebook app) and can be found here. Sufficient instructions are included. edit: We have noticed some issues with the TK library on some computers where the code hangs.
Jupyter notebooks can be run through the Anaconda Python distribution downloadable from http://anaconda.org
Let me know if you find it useful.
Tuesday, 31 July 2018
Oh no, not again!
It is the summer break in academia and we are either taking our well earned holidays or preparing material for the next session. A publisher has sent us a bunch of text books to look at - they hope we like them and would recommend them to the students for our courses.
Disclaimer: Whilst we are provided with the textbooks for no personal cost, there are no inducements to promote a particular book or publisher. Each book stands (or falls) on it's own merits.
I have an interest in improving the numeracy and basic data literacy amongst our students, so one of the titles appealed to me. It covered basic arithmetic though various applications in the lab. And one of those specific applications is Enzyme Kinetics.
The Michaelis-Menten equation is one of the foundations of kinetic analysis and the results can be represented in various ways. One of the classical method was developed by Lineweaver and Burk in 1934. It is superficially attractive in that the data is transformed from a hyperbolic curve to a straight line but suffers from reciprocal scaling of the errors. As it is a double reciprocal plot (plotting the inverse of one value against the inverse of the other) small errors in measurement at small values in the test tube become huge errors at huge values in the analysis. The plot has many uses for visualising the data though - identification of mechanism of inhibition is one of the classical examples given in introductory undergraduate lectures.
The problem comes when the plot is used for the determination of the constants (Vmax and Km) rather than their visualisation. Because of the reciprocal scaling of the errors, the estimates can be extremely unsafe (how much so we will get to in a moment). This was recognised by Lineweaver and Burk but this is typically left as an unquantified warning to students to be careful about their errors.
Since 1934 there have been other representations of the Michaelis-Menten equation that transform the data to linear forms. The Eadie-Hoftzee and Haynes-Woolf plots both provide linear transformations though interpretation and extraction of the parameters is marginally more complex than a simple reciprocal of the value of the intercepts on the x and y axes.
More recently the advent of computational methods of direct fitting to the equation removes the issue of error scaling completely and there is no real excuse for not using the direct method in any serious experimental study.
I wanted to see just how well each method would be in reconstructing correctly the correct parameters so constructed a small simulation. Taking a fixed Km and Vmax I can calculate the expected values for V at given substrate concentrations. Needless to say with ideal data every method retrieves the expected values perfectly.
In the lab, however, the world is not perfect. I therfore add fixed errors corresponding to measurement errors as one might find on reading a typical UV/Vis spectrometer, and proportional errors such as might be expected from pipetting. I repeat each experiment 10 times and calculate mean/SD for the parameters. The calculations for the Lineweaver-Burk plot are performed with no error weighting, such as might be done in a typical undergrad classroom.
The results are clear. Lineweaver-Burk is giving extremely poor results - so much so that one would never consider it for any analysis.
The simulation can be found here (PDF) (R Source [latex]) if you want to work through it yourself. I recommend the RStudio IDE and you will need appropriate software for Sweave/Latex.
So back to the book. They provide a suitable treatment of the Michaelis-Menten equation but the only experimental treatment for determining the kinetic constants is the Lineweaver-Burk plot, with a cursory half sentence hinting that it may not be suitable. There is no consideration of alternative approaches. It is a pretty damning effort - the book is otherwise quite approachable and could otherwise be recommended, but serious errors where we have to correct the textbooks render it unacceptable. I'm not going to name the book or publisher, but will be contacting the authors directly.
Subscribe to:
Posts (Atom)